One piece of software for proofs I have been very impressed with over the years was presented some time ago at a seminar at the School of Education. It was presented by Professor Mikio Miyazaki, co-applicant of this project. He showcased some of his work on a flowchart tool for (geometric) proofs at Schoolmath. I loved it and would love to see this integrated as widgets in the Digital Mathematical Environment, for example. Within the project we are working on integrating the tool in the two promised digital (c-)books. In addition, part of the tool will be ported to HTML5 so it can be used on tablets (now it is Flash based).
I will provide an overview in some screenshots.
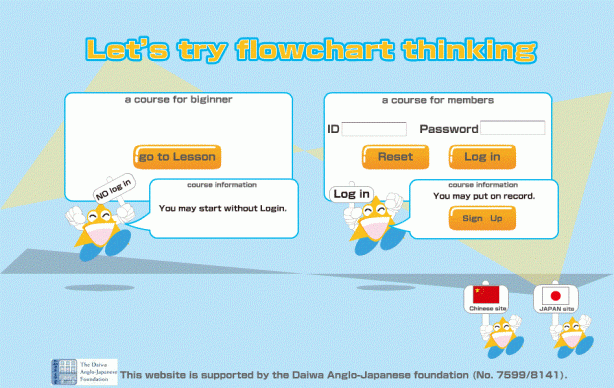
1. This is the entry screen. The flowchart tool is part of a larger environment that stores student information.
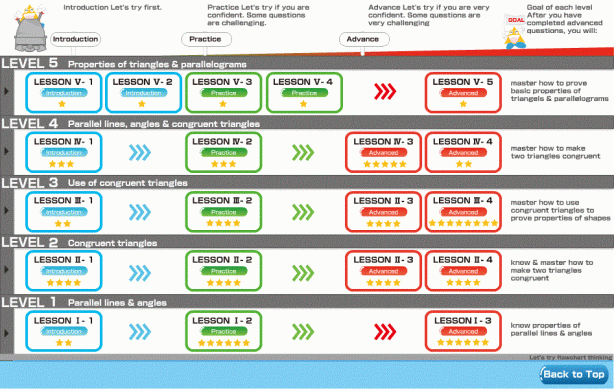
2. The materials are presented in a nice overview with levels. The stars do NOT denote difficulty but in how many ways you can actually proof the theorem that is presented.
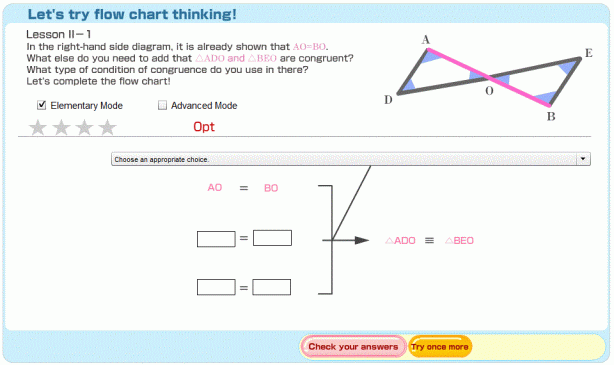
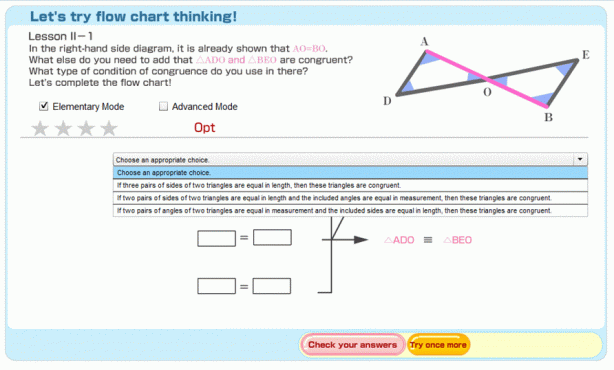
3. I will choose the section on congruency. Students are presented with a geometry task and are asked to prove the theorem presented (I did not yet manage to find out what the difference between elementary mode and advanced mode is). In this particular example there are four stars, so four possible ways to prove it with the help of congruency. Students have to fill in the flowchart by choosing a strategy/action and providing angles and sides. I love the fact that I can just drag and drop angles and sides to the answer boxes and they will appear there.
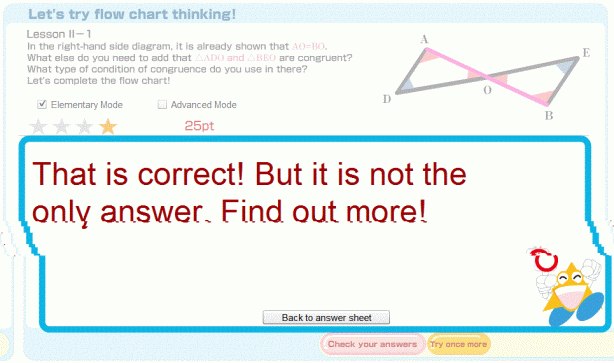
4. Having filled in the flowchart the answer can be checked. One of the four stars is coloured yellow.
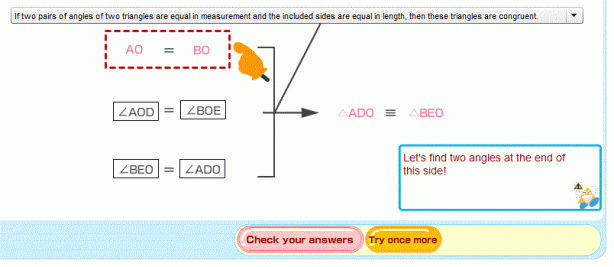
5. Wrong answers are provided with feedback and an indication where the mistake is:
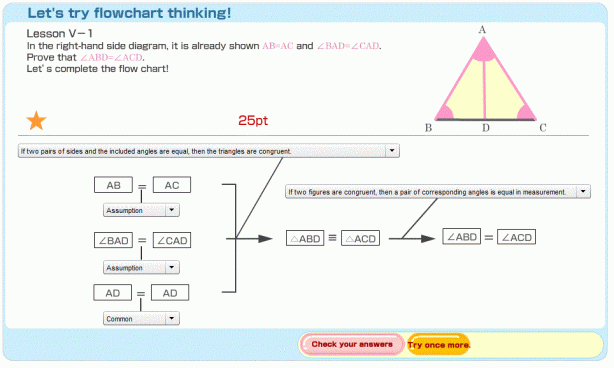
6. Another final example:
Posted By : Christian Bokhove